图像处理笔记 -- 图像缩放插值算法直观感受
写了一个 Python 直观感受各种图像缩放插值算法。越高级的算法越圆润,越基础的算法马赛克效果越明显。
- INTER_NEAREST – 最近邻插值法 "nearest"
- INTER_LINEAR – 双线性插值法(默认)“linear", "bilinear", "trilinear", "triangle"
- INTER_AREA – 基于局部像素的重采样(resampling using pixel area relation)
- INTER_CUBIC – 基于 4x4 像素邻域的 3 次插值法 "cubic", "bicubic", "tricubic"
- INTER_LANCZOS4 – 基于 8x8 像素邻域的 Lanczos 插值 "lanczos4"
先上图

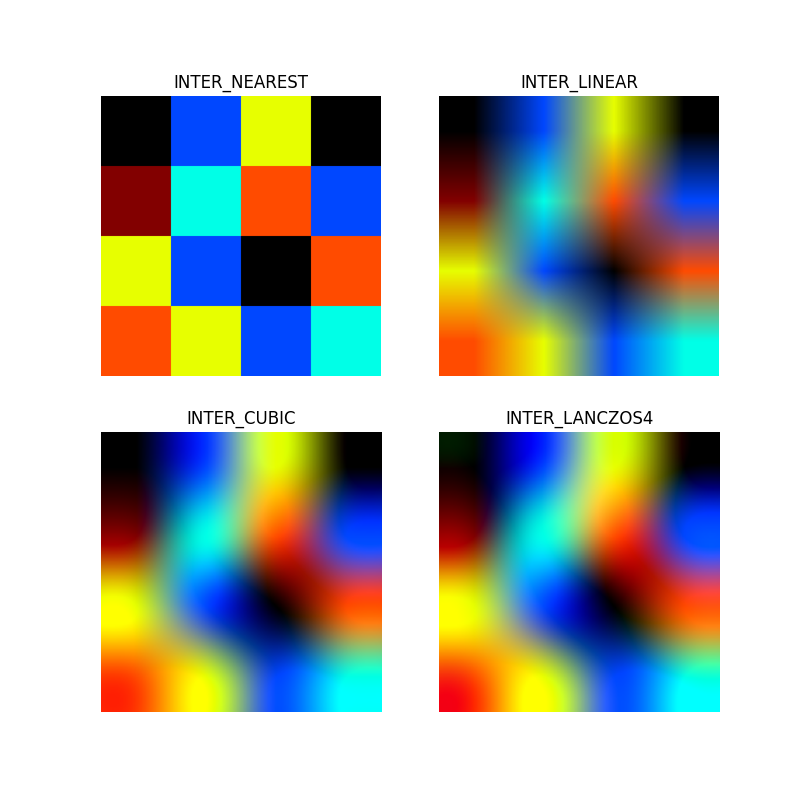

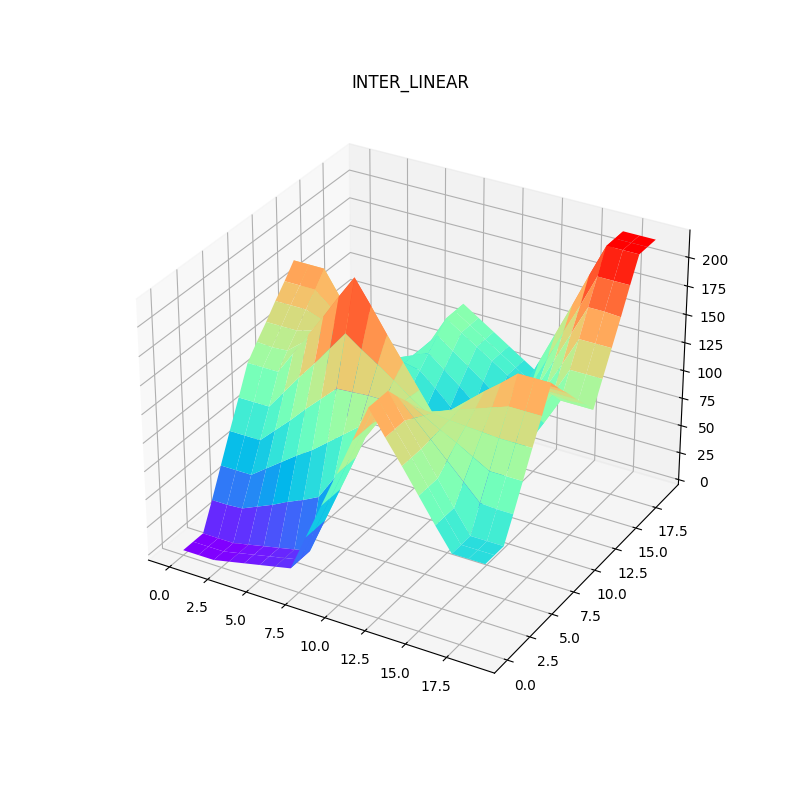
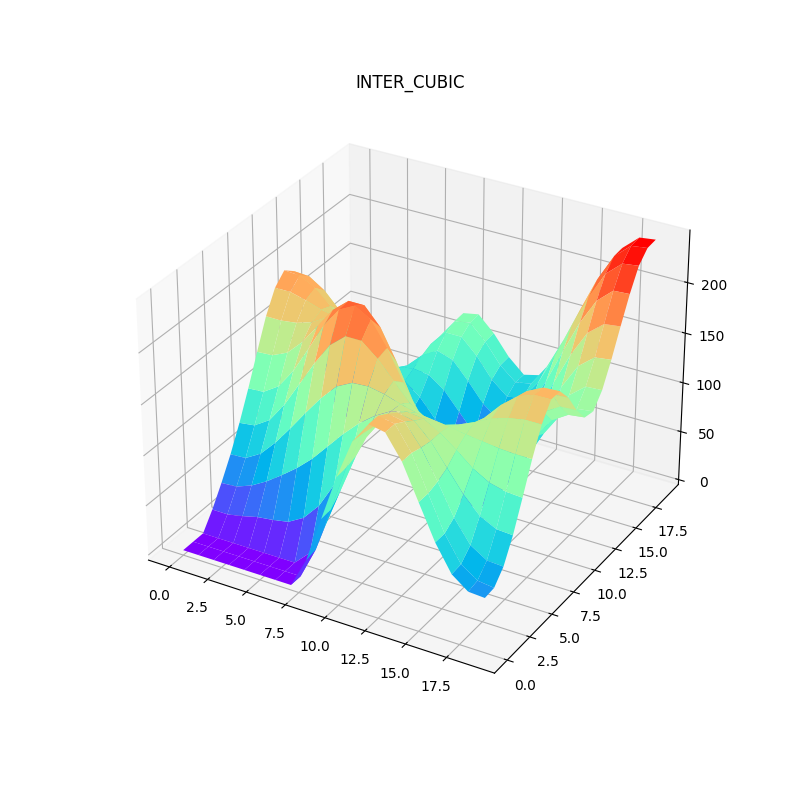
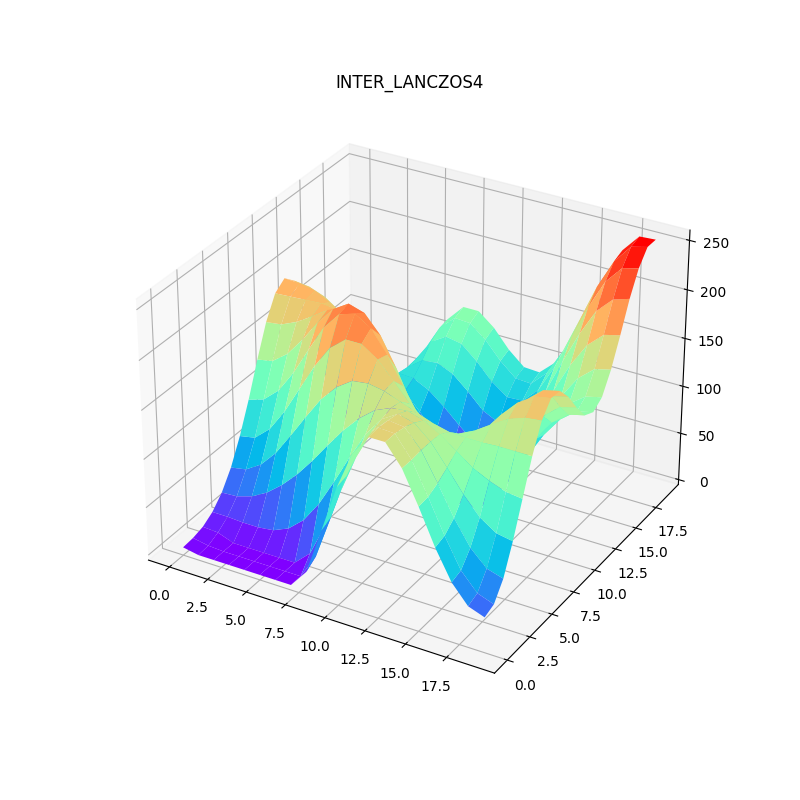
Python 代码
#encoding=utf8
import re, os, sys
import matplotlib.pyplot as plt
import numpy as np
import cv2

def strcolor(str):
    return [int(str[0:2], 16),
            int(str[2:4], 16),
            int(str[4:6], 16)]

def imgshow(img, title="result"):
    cv2.imshow(title, img)
    cv2.waitKey(0)
    cv2.destroyAllWindows()

def imgshow4(imga, titlea, imgb, titleb, imgc, titlec, imgd, titled):
    plt.figure(num='result', figsize=(8,8))

    plt.subplot(2, 2, 1)
    plt.title(titlea)
    plt.imshow(imga)
    plt.axis('off')

    plt.subplot(2, 2, 2)
    plt.title(titleb)
    plt.imshow(imgb)
    plt.axis('off')

    plt.subplot(2, 2, 3)
    plt.title(titlec)
    plt.imshow(imgc)
    plt.axis('off')

    plt.subplot(2, 2, 4)
    plt.title(titled)
    plt.imshow(imgd)
    plt.axis('off')
    plt.show()

# https://www.oreilly.com/library/view/python-data-science/9781491912126/ch04.html
def imgshow4_3d(imga, titlea, imgb, titleb, imgc, titlec, imgd, titled):
    plt.figure(num='result3d', figsize=(8,8))
    xx, yy = np.mgrid[0:imga.shape[0], 0:imga.shape[1]]

    cfg = plt.subplot(2, 2, 1, projection='3d')
    cfg.set_title(titlea)
    cfg.plot_surface(xx, yy, imga, rstride=1, cstride=1, cmap=plt.cm.jet, linewidth=0, antialiased=False)
    plt.axis('off')

    cfg = plt.subplot(2, 2, 2, projection='3d')
    cfg.set_title(titleb)
    cfg.plot_surface(xx, yy, imgb, rstride=1, cstride=1, cmap=plt.cm.jet, linewidth=0, antialiased=False)
    plt.axis('off')

    cfg = plt.subplot(2, 2, 3, projection='3d')
    cfg.set_title(titlec)
    cfg.plot_surface(xx, yy, imgc, rstride=1, cstride=1, cmap=plt.cm.jet, linewidth=0, antialiased=False)
    plt.axis('off')

    cfg = plt.subplot(2, 2, 4, projection='3d')
    cfg.set_title(titled)
    cfg.plot_surface(xx, yy, imgd, rstride=1, cstride=1, cmap=plt.cm.jet, linewidth=0, antialiased=False)
    plt.axis('off')

    plt.show()

def imgshow3d(imga, titlea):
    plt.figure(num=titlea, figsize=(8,8))
    xx, yy = np.mgrid[0:imga.shape[0], 0:imga.shape[1]]
    # https://matplotlib.org/mpl_toolkits/mplot3d/tutorial.html
    ax = plt.axes(projection='3d')
    ax.plot_surface(xx, yy, imga, rstride=1, cstride=1, cmap=plt.get_cmap('rainbow'), edgecolor='none') # 'viridis'
    plt.title(titlea)
    plt.show()

def imgtest(myimg, interpolation, fxy=100):
    img = cv2.resize(myimg, (0, 0), fx=fxy, fy=fxy,
                     interpolation=interpolation).astype(np.uint8)
    return img

# INTER_NEAREST  - 最近邻插值法
# INTER_LINEAR   - 双线性插值法(默认)
# INTER_AREA     - 基于局部像素的重采样(resampling using pixel area relation)
# INTER_CUBIC    - 基于 4x4 像素邻域的 3 次插值法
# INTER_LANCZOS4 - 基于 8x8 像素邻域的 Lanczos 插值
# https://github.com/pytorch/pytorch/issues/25039
def main():
    imagestr = """
000000 0047ff e7ff00 000000
820000 00ffe7 ff4b00 0047ff
e7ff00 0047ff 000000 ff4b00
ff4b00 e7ff00 0047ff 00ffe7
"""
    imagestr2 = """
00007f 2fffc7 00bcff 00007f 000000 0047ff e7ff00 000000
00b0ff de0000 32ffc3 56ffa0 820000 00ffe7 ff4b00 0047ff
ffd300 53ffa3 ffd300 0050ff e7ff00 0047ff 000000 ff4b00
ff7600 7f0000 0090ff 32ffc3 ff4b00 e7ff00 0047ff 00ffe7
000000 0047ff e7ff00 000000 00007f 2fffc7 00bcff 00007f
820000 00ffe7 ff4b00 0047ff 00b0ff de0000 32ffc3 56ffa0
e7ff00 0047ff 000000 ff4b00 ffd300 53ffa3 ffd300 0050ff
ff4b00 e7ff00 0047ff 00ffe7 ff7600 7f0000 0090ff 32ffc3
"""
    myimage = [strcolor(color) for color in imagestr.split()]
    ksize = round(len(myimage) ** 0.5)
    myimage = np.asarray(myimage).reshape(ksize, ksize, 3).astype(np.uint8)

    nearest  = imgtest(myimage, cv2.INTER_NEAREST, 50)
    linear   = imgtest(myimage, cv2.INTER_LINEAR, 50)
    cubic    = imgtest(myimage, cv2.INTER_CUBIC, 50)
    lanczos4 = imgtest(myimage, cv2.INTER_LANCZOS4, 50)

    imgshow4(nearest, "INTER_NEAREST",
        linear, "INTER_LINEAR",
        cubic, "INTER_CUBIC",
        lanczos4, "INTER_LANCZOS4",
    )

    myimage = cv2.cvtColor(myimage, cv2.COLOR_BGR2GRAY)

    nearest  = imgtest(myimage, cv2.INTER_NEAREST, 5)
    linear   = imgtest(myimage, cv2.INTER_LINEAR, 5)
    cubic    = imgtest(myimage, cv2.INTER_CUBIC, 5)
    lanczos4 = imgtest(myimage, cv2.INTER_LANCZOS4, 5)

    imgshow3d(nearest, "INTER_NEAREST")
    imgshow3d(linear, "INTER_LINEAR")
    imgshow3d(cubic, "INTER_CUBIC")
    imgshow3d(lanczos4, "INTER_LANCZOS4")

if __name__ == "__main__":
    main()
后来发现网上有类似代码
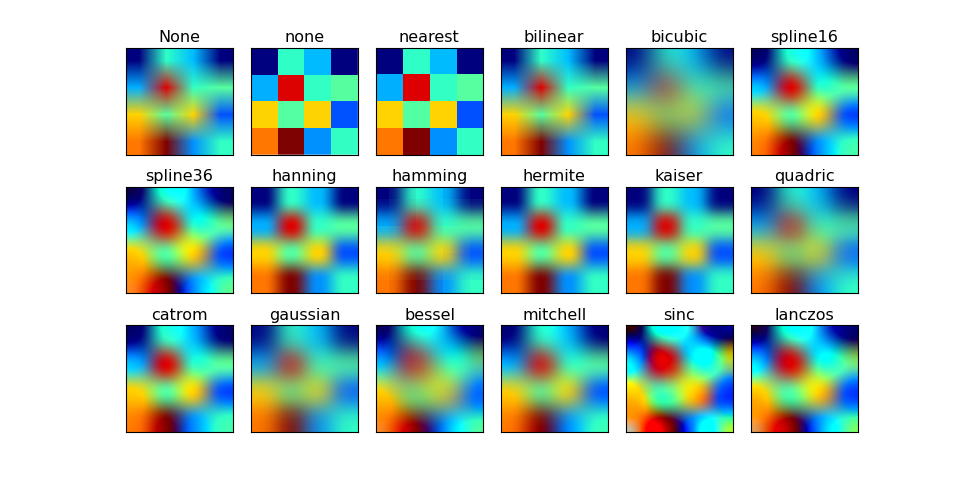
- 展示差异与原理 Interpolation
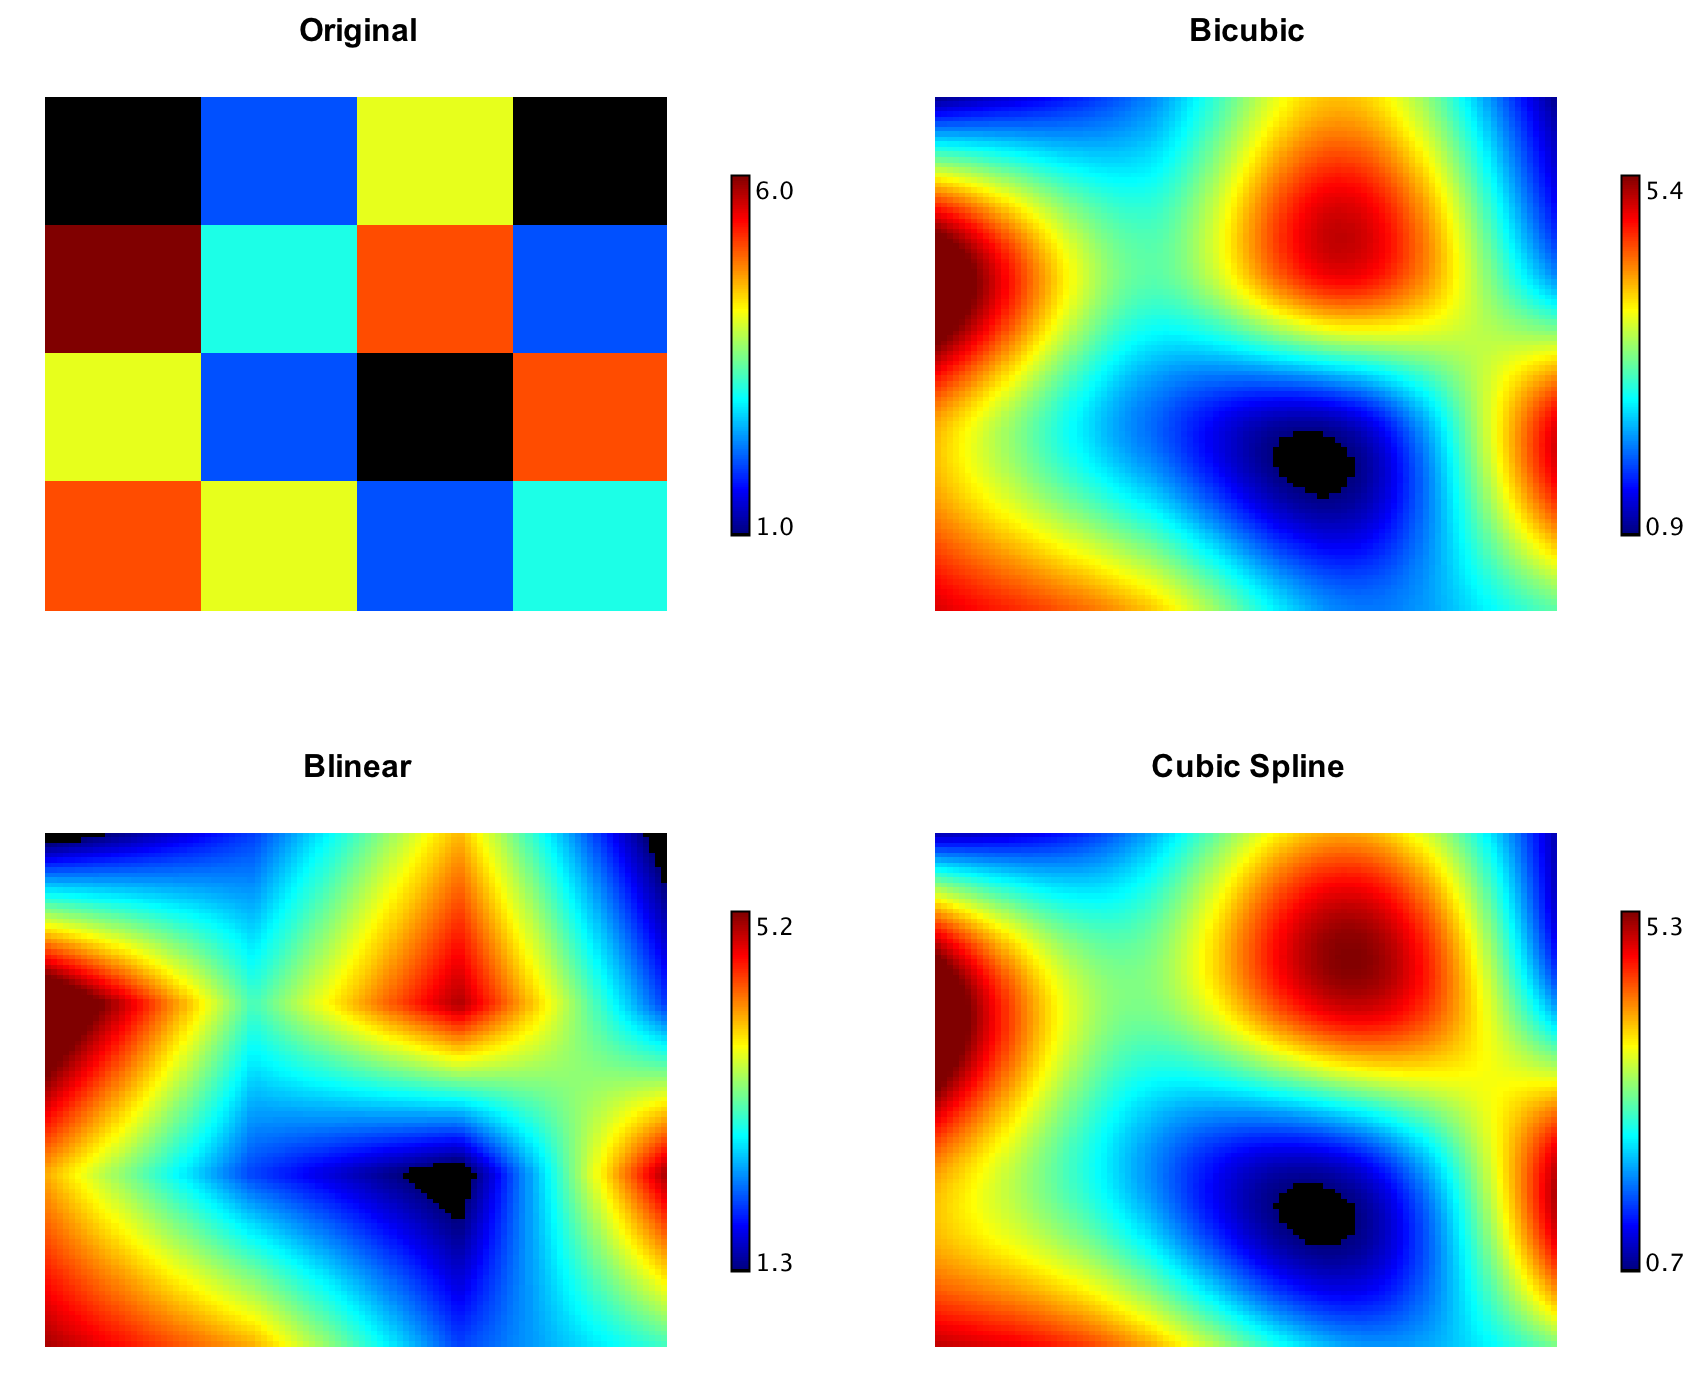


参考资料快照
- https://www.oreilly.com/library/view/python-data-science/9781491912126/ch04.html
- https://matplotlib.org/mpl_toolkits/mplot3d/tutorial.html
- https://github.com/pytorch/pytorch/issues/25039
- https://matplotlib.org/1.4.1/examples/images_contours_and_fields/interpolation_methods.html
- http://haifengl.github.io/interpolation.html
- https://blog.csdn.net/guyuealian/article/details/85097633
- https://www.ipol.im/pub/art/2011/g_lmii/article.pdf
- https://clouard.users.greyc.fr/Pantheon/experiments/rescaling/index-en.html
参考资料快照

 .
.