编程与调试 Memory -- Windows 内存类型介绍
- 工作集 – 物理内存
-
提交大小 - 虚拟内存
- 对于 32 位系统,CPU 可直接寻址 2^32=4GB 空间,这也是每个进程的地址空间大小
- 高 2GB 供内核模块使用,称为内核空间。低 2GB 供用户态模块使用,称为用户空间
-
使用 /3GB 开关启动,可以将用户空间增大到 3GB
- 每个 Win32 进程有 4GB 空间,但用户态代码只能访问 2GB 用户空间
- 所有进程共享内核空间
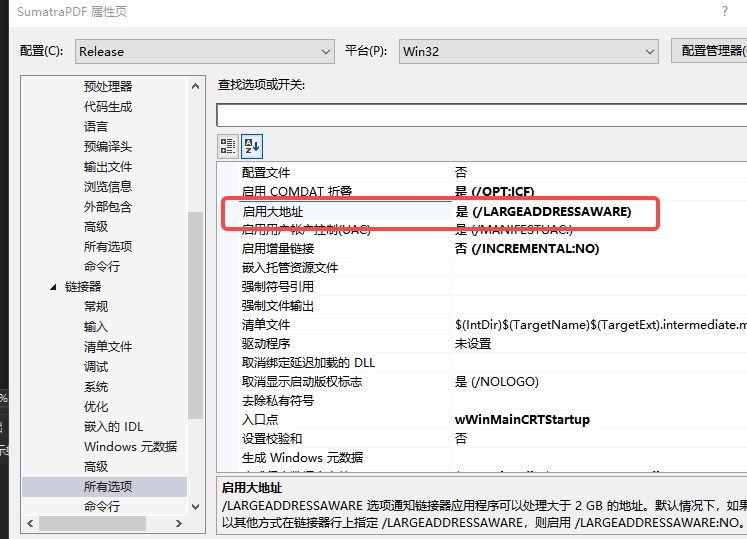
使用 LargeAddressAware 扩展程序内存地址空间
当然这种方法的缺点:
- 在 64 位系统上没办法使用超过 4GB 的内存;不过以前只能用 2G,聊胜于无了;
- 在 32 位系统上必须打开 /3GB 启动参数,为用户态程序预留 3GB 的内存
- 对于带有自校验的程序,不适用,因为 dumpbin 相当于修改了这个 exe,那么文件校验肯定是失败了;
子系统 DLL
- ADVAPI32.DLL 如下 API 的入口:数据加密(Crpt 开头);用户和帐号管理(Lsa 开头); 注册表操作(Reg 开头);WMI(Wmi 开头);终端服务(Wts 开头)
- GDI32.DLL 包含各种图形文字绘制 API(GDI)的入口,如 TextOut()、BitBlt() 等。 其中大多数 API 是被转换为系统服务发给内核态的 Windows 子系统驱动程序(Win32K.SYS)
- KERNEL32.DLL 与系统服务有关的 API 的入口,如进程 / 线程管理,如 CreateThread(); 调试(Debug 开头);文件操作,包括创建、打开、读写、搜索等; 内存分配(Local 开头和 Global 开头)其中大多数 API 是被转换为系统服务发给内核态的执行体。
- USER32.DLL 包含窗口管理、消息处理和用户输入 API,如 EndDialog()、BeginPaint()、SetWindowPos()、MessageBox() 等。其中大多数 API 是被转换为系统服务发给内核态的 Windows 子系统驱动程序(Win32K.SYS)
Windows 内存类型
Windows 上的内存有好几种说法,比如工作集(Working Set)、提交大小(Private Bytes)、虚拟大小(Virtual Size)。 究竟这几种说法有什么区别?每种内存到底指的是什么?哪种内存才能真正反映程序使用的内存情况? 虽然做 Windows 开发这么久,一直对这些只有模糊的认识。 如果你去网上找寻答案,可能会找到一些错误的或者矛盾的说法,这更加让人感到迷惑。 最近要处理 Chromium 内核一些因此内存不足而导致的崩溃问题,所以才深入去研究一下这个问题。
Windows 上的程序都有自己专有的虚拟地址空间,比如 32 位的程序地址空间大小是 4GB,这是因为 32 位指针可以表示从 0x00000000 到 0xFFFFFFFF 之间的任一值。每个进程的地址空间是专有的, 当前进程只能访问到该进程的内存,看不到其他进程的内存。 不同进程虽然访问同一个内存地址,实际上它们得到的数据是不同的。
虚拟地址空间不是真正的内存,不能够直接读写。当程序需要读写的时候,操作系统会在背后把物理存储器分配或者映射到相应的地址空间, 否则将会导致访问违例(access violation)。
我们可以通过 VirtualAlloc API 分配一块地址空间的区域,这个操作被称之为预订(reserving)。 当程序预订地址空间区域时,操作系统会确保区域的起始地址正好是分配粒度的整数倍。 分配粒度会根据不同的 CPU 平台而有所不同。目前 Windows 分配粒度是 64KB 大小。 页面是一个内存单元,系统通过它来管理内存。与分配粒度类似,页面大小会根据不同 CPU 而有所不同, x86 和 x64 页面大小是 4KB,而 IA-64 系统页面大小是 8KB。
为了使用预订的地址空间区域,我们还必须分配物理存储器,并将存储器映射到所预订的的区域, 这个过程被称之为调拨(committing)物理存储器。物理存储器始终都以页面为单位来调拨。
当我们调拨物理存储器给区域时,并不需要给整个区域都调拨物理存储器。 当程序不再需要访问所预订的区域中已调拨的物理存储器时,应该释放物理存储器。 这个过程被称之为撤销调拨(decommitting)物理存储器。
当今操作系统能让磁盘空间看起来像内存一样。磁盘上的文件被称之为页交换文件(paging file)。 页交换文件以一种透明的方式增大了程序可用的内存(或存储器)的总量。 如果一台电脑装备了 1GB 的内存条,硬盘上还有 1GB 的页交换文件,那么应用程序会认为可用的内存总量为 2GB。
我写了一个 inspect_memory 的程序来验证各种分配内存方式对不同内存指标的影响:
- 通过 new 分配内存 10MB,工作集(Working Set)增加 10MB,提交大小(Private Bytes)增加 10MB,虚拟大小(Virtual Size)增加 10MB。
- 通过 VirtualAlloc 预订(reserving)内存 10MB,工作集(Working Set)大小不变,提交大小(Private Bytes)大小不变,虚拟大小(Virtual Size)增加 10MB。
- 通过 VirtualAlloc 预订(reserving)并调拨(committing)内存 10MB,工作集(Working Set)增加 10MB,提交大小(Private Bytes)增加 10MB,虚拟大小(Virtual Size)增加 10MB。
- 运行多个 inspect_memory 实例。在每个实例上通过 new 分配了很多内存,比如工作集(Working Set)、(Private Bytes)、虚拟大小(Virtual Size)都接近 2GB 停止。 任务管理性能 tab 上显示的可用的物理内存很少时,发现先前实例的工作集(Working Set)在慢慢减少, 而(Private Bytes)、虚拟大小(Virtual Size)保持不变。
通过上述实验,参考 https://stackoverflow.com/questions/1984186/what-is-private-bytes-virtual-bytes-working-set 可以得出结论:
- 提交大小(Private Bytes)是进程分配的内存大小。这些内存可能存在于 RAM 中,也可以存在于页交换文件(paging file)中。
- 工作集(Working Set)是进程存在于 RAM 中内存的大小,即不引起 page fault 异常就能够访问的内存。它通常包括一些可与其他进程共享的内存,比如内存映射文件。
- 虚拟大小(Virtual Size)是进程地址空间预订的区域大小。
- 操作系统会自动调度程序工作集(Working Set)内存的使用。
因此我觉得用提交大小(Private Bytes)来衡量程序使用内存的情况比较恰当,虽然提交大小(Private Bytes)不一定真正的占用 RAM 内存, 但是提交大小(Private Bytes)一直增加,那么程序很可能存在内存使用不当的情况。 除了操作系统去调度程序工作集(Working Set)内存的大小,我们也可以通过 SetProcessWorkingSetSize、SetProcessWorkingSetSizeEx、EmptyWorkingSet 等 API 去手动设置工作集(Working Set)的大小。 360 安全卫士的内存优化功能大概就是通过这些 API 去实现的。 使用这些 API 减少工作集(Working Set)的大小有点像掩耳盗铃,它是把进程存在于 RAM 中的内存交换到页交换文件(paging file)里, 表面上是减少了物理内存的使用,实际上程序真正需要访问这些数据的时候, 又需要操作系统把页交换文件(paging file)里数据交换到 RAM 内存中,增加了不必要的调度, 反而影响了程序的运行性能,我们未必有操作系统的工作集(Working Set)调度做的好。
这些内存数据我们可以通过系统提供的 API 获得:
- GetProcessMemoryInfo 获得 PROCESS_MEMORY_COUNTERS_EX 数据,WorkingSetSize 字段表示进程的工作集(Working Set)大小。
- GetProcessMemoryInfo 获得 PROCESS_MEMORY_COUNTERS_EX 数据,PrivateUsage 字段表示进程的提交大小(Private Bytes)大小。
- GlobalMemoryStatusEx 获得 MEMORYSTATUSEX 数据,ullTotalVirtual 减去 ullAvailVirtual 就是虚拟大小(Virtual Size)大小。
区别 ^_^
The short answer to this question is that none of these values are a reliable indicator of how much memory an executable is actually using, and none of them are really appropriate for debugging a memory leak.
-
Private Bytes refer to the amount of memory that the process executable has asked for - not necessarily the amount it is actually using. They are "private" because they (usually) exclude memory-mapped files (i.e. shared DLLs). But - here's the catch - they don't necessarily exclude memory allocated by those files. There is no way to tell whether a change in private bytes was due to the executable itself, or due to a linked library. Private bytes are also not exclusively physical memory; they can be paged to disk or in the standby page list (i.e. no longer in use, but not paged yet either).
-
Working Set refers to the total physical memory (RAM) used by the process. However, unlike private bytes, this also includes memory-mapped files and various other resources, so it's an even less accurate measurement than the private bytes. This is the same value that gets reported in Task Manager's "Mem Usage" and has been the source of endless amounts of confusion in recent years. Memory in the Working Set is "physical" in the sense that it can be addressed without a page fault; however, the standby page list is also still physically in memory but not reported in the Working Set, and this is why you might see the "Mem Usage" suddenly drop when you minimize an application.
-
Virtual Bytes are the total virtual address space occupied by the entire process. This is like the working set, in the sense that it includes memory-mapped files (shared DLLs), but it also includes data in the standby list and data that has already been paged out and is sitting in a pagefile on disk somewhere. The total virtual bytes used by every process on a system under heavy load will add up to significantly more memory than the machine actually has.
So the relationships are:
- Private Bytes are what your app has actually allocated, but include pagefile usage;
- Working Set is the non-paged Private Bytes plus memory-mapped files;
- Virtual Bytes are the Working Set plus paged Private Bytes and standby list.
There's another problem here; just as shared libraries can allocate memory inside your application module, leading to potential false positives reported in your app's Private Bytes, your application may also end up allocating memory inside the shared modules, leading to false negatives. That means it's actually possible for your application to have a memory leak that never manifests itself in the Private Bytes at all. Unlikely, but possible.
Private Bytes are a reasonable approximation of the amount of memory your executable is using and can be used to help narrow down a list of potential candidates for a memory leak; if you see the number growing and growing constantly and endlessly, you would want to check that process for a leak. This cannot, however, prove that there is or is not a leak.
One of the most effective tools for detecting/correcting memory leaks in Windows is actually Visual Studio (link goes to page on using VS for memory leaks, not the product page). Rational Purify is another possibility. Microsoft also has a more general best practices document on this subject. There are more tools listed in this previous question.
参考
- https://bbs.pediy.com/thread-156036.htm
- https://stackoverflow.com/questions/1984186/what-is-private-bytes-virtual-bytes-working-set
- https://docs.microsoft.com/zh-cn/windows/desktop/Memory/working-set
- Windows 核心编程
参考资料快照
 .
.